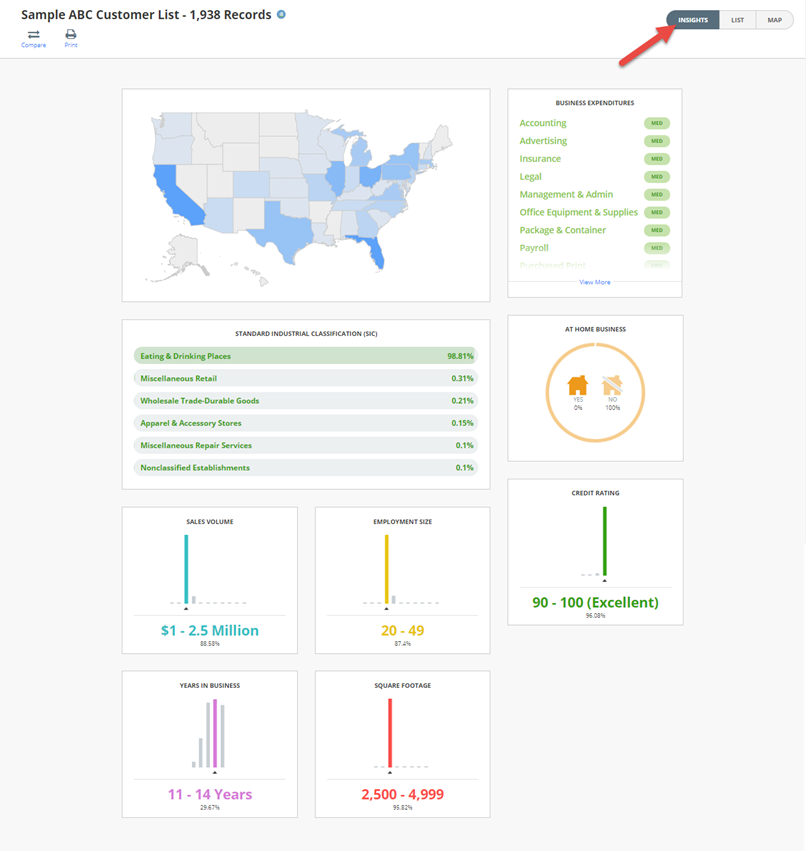
The INSIGHTS page (otherwise known as the “Analytics” page) will show you the demographics (consumer) or firmographics (business) that make up your list using visualization charts and graphs. The following data elements will be displayed:
Business : Geography (state, cities, counties), SIC, Sales Volume, Employment Size, Years in Business, Square Footage, Business Expenditures, and At Home Business.
Consumer : Geography (state, cities, counties), Age, Gender, Income, Presence of Children, Home Value, Home Owner, Ethnic Groups, Lifestyles and InfoPersona.

A Salesgenie user can access the analytics screens by first selecting one of their Salesgenie or Imported Consumer or Business Lists followed by selecting the “INSIGHTS” toggle button located next to the List and Map buttons on the upper right of the Details page.