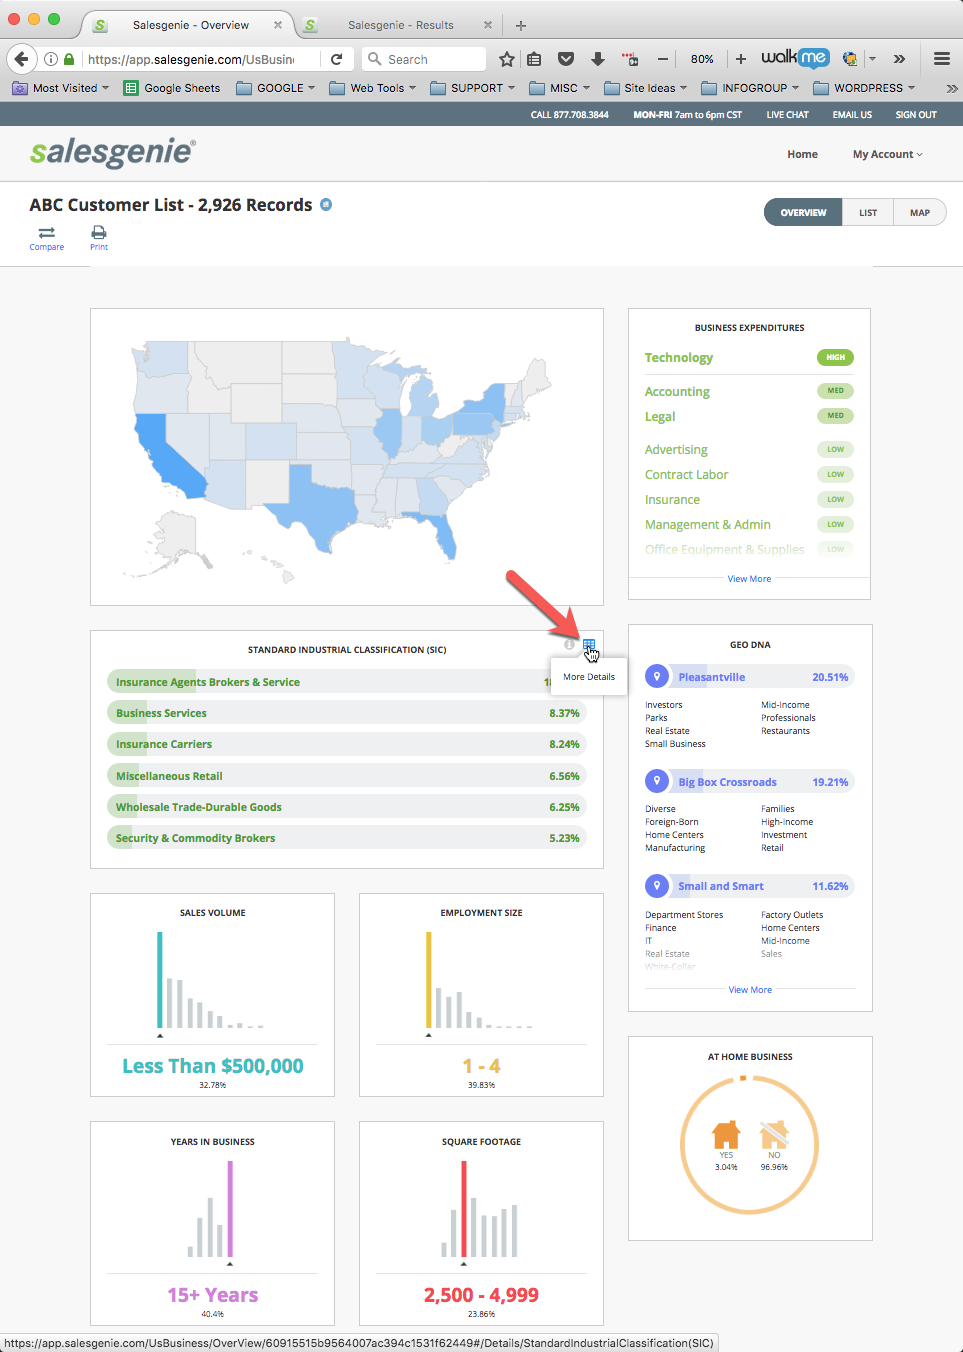
Start with your first list, (for example, your customer list) and click on the “OVERVIEW” tab in the top right corner of your screen.

This will take you to the OVERVIEW screen where you’ll see a visual summary of your list’s appended criteria, each in a visual graph or chart.
Find the element that you’d like to compare. For example we will look at “Industry / SIC Code” (STANDARD INDUSTRIAL CLASSIFICATION CODE). Hover your mouse over that element and you’ll see a “chart” icon appear with the tooltip “More Details”. Click here
From this detail screen you see a “Compare” icon (found on the upper left below the name of the list). Click “Compare” and then click “Benchmark”.
Here you’ll see a side-by-side the comparison of the demographics/firmographics between your imported list and the “Benchmark” list. (Benchmark is the general population surrounding the uploaded list)
From the side-by-side “Compare” screen, you will see:
- Your uploaded list - % of your total records and # of records in each segment
- The Benchmark list - % of the benchmark records and # of records in each segment
-
Market Penetration
- Penetration Rate - Represents the count of each SIC value covered in the uploaded list compared to the count of each SIC values in the Benchmark, expressed as a percent.
- Penetration Index - The Penetration Index compares your current market share (% of customers) to your potential market share (% of all businesses / households within the segment and your geographic footprint), and is referred to as the “Benchmark" (underlying population). Keep in mind that the penetration index only looks at the number of customers vs the benchmark and does not take any additional attributes into account. (revenue, number of orders, average order size, etc.) Penetration Index is one of many variables you should take into consideration.
- Each segment can be expanded to see more detail
- Switch and compare different elements
- Exit comparison


